Case Study
Safe Display
Empowering enterprise workplace teams to make fast, data-driven decisions about physical distancing during the height of the COVID-19 pandemic.
- Role
- Product Design Lead
- Timeline
- 6 weeks (pandemic response sprint)
- Platforms
- Web dashboard & 55" digital signage
- Partners
- Product, Engineering, Data Science
Project Overview
Helping workplaces reopen responsibly.
In the early months of the pandemic, Density needed a way to translate live occupancy sensing into signage that guided people to safe spaces. I led design across the data visualization dashboard and a companion digital signage experience that broadcasted when a space had reached capacity.
What we shipped
- Responsive web dashboard for real-time and historical occupancy monitoring.
- Configurable alert thresholds per building, floor, and room.
- Digital signage templates that automatically cycle through states.
- Content governance system for facilities and communications teams.
My contributions
- Aligned stakeholders on product vision and scope within a two-week sprint.
- Designed the information architecture for multi-property portfolios.
- Created the visual language for signage that balanced urgency with calm.
- Established handoff specs, accessibility guidance, and QA support.
Impact
Turning sensor data into actionable confidence.
Real-time occupancy insight
Mapped building, floor, and room level capacity to give teams confidence on how many people could safely be on-site at once.
Simple guidance for employees
Translated dense health regulations into easy-to-scan signage states that helped employees understand when a space was safe to enter.
Frictionless operations
Automated signage updates from live sensor data so workplace teams could focus on change management instead of manual reporting.
The Challenge
Translate evolving regulations into calm, clear guidance.
Observations
Workplace teams were inundated with changing local guidelines and had little time to interpret what they meant for each location. Employees needed reassurance that the office wasn't overcrowded, but existing signage was static and quickly outdated.
Opportunity
By marrying live occupancy data with intuitive communication patterns, we could help organizations keep people safe while demonstrating compliance for executives, HR, and legal stakeholders.
Solution
Designing a language employees could trust.
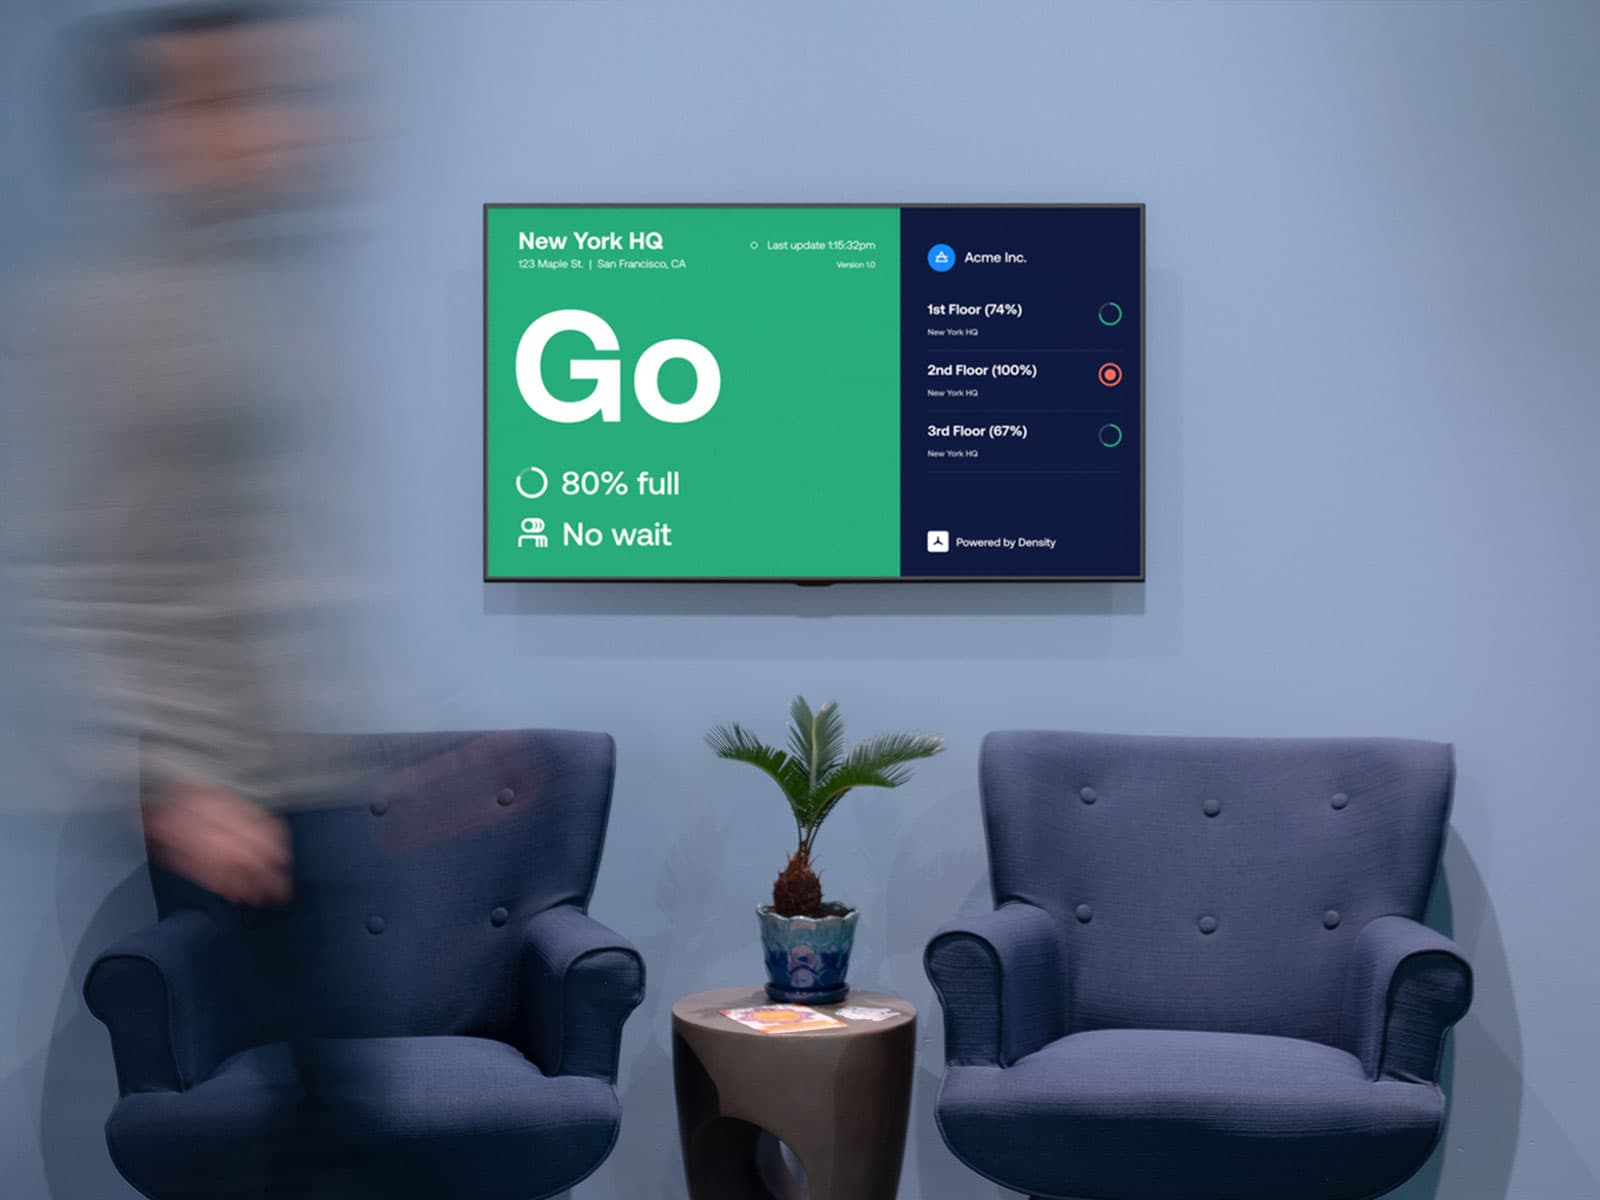
We distilled complex occupancy math into a simple set of signage states that could be recognized at a glance from across the lobby. The same signals mirrored the dashboard so facilities, HR, and executives were aligned on what action to take.
Green — Safe to enter
Space is well below threshold and cleaning schedules are up to date.
Yellow — Nearing capacity
Employees are prompted to wait or find an alternate room with lower occupancy.
Red — At capacity
Automated alerts notify facilities teams and trigger follow-up cleaning workflows.
Process
Designing at the speed of an emergency response.
Rapid discovery
Interviewed workplace leaders across Fortune 500 clients to understand pain points around reopening plans, signage management, and compliance.
Systems mapping
Audited sensor coverage, badge data, and municipal requirements to define source-of-truth data flows for room capacity and alert thresholds.
Prototyping & validation
Built interactive prototypes for both a planning dashboard and digital signage loops, then validated messaging comprehension with pilot teams.
Release support
Partnered with engineering to QA the responsive web experience, define content governance, and document rollout playbooks for customer success.
Data you can stand behind
Ensuring every signal was accurate and defensible.
Data credibility mattered more than ever. We mapped how each sensor, badge reader, and policy update would flow into Safe Display so customer teams knew what to expect before launch.
Sensor coverage audit
Mapped badge events and infrared sensing to validate people counting accuracy across lobbies, hallways, and conference rooms.
Policy mapping
Codified each municipality’s distancing and cleaning rules into reusable configurations that could be applied per building.
Alert orchestration
Documented how signage, in-app alerts, and email reports should react when capacity or cleaning thresholds were hit.
Experience Highlights
Balancing clarity and urgency across every touchpoint.


“Safe Display helped our facilities and HR teams communicate clear capacity limits without adding new workstreams. Employees trusted the data because it was grounded in real-time sensing.”
Director of Workplace Experience, Fortune 100 client
Results
From crisis solution to lasting operations tool.
Within weeks of launch, Safe Display became a core part of Density's return-to-office playbook. Enterprises rolled the signage out across hundreds of locations, and customer success teams used the dashboard to advise clients on portfolio-level reopening strategies.
- Backed executive reopening decisions with verifiable data.
- Accelerated compliance reporting for legal and HR partners.
- Set the foundation for Density's long-term workplace analytics roadmap.
Building a critical product under tight deadlines?
Let's partner to align stakeholders, prototype rapidly, and launch with confidence.
Start a conversation